Insight Update – Simplifying Operational Complexity
Calculated statistics for events
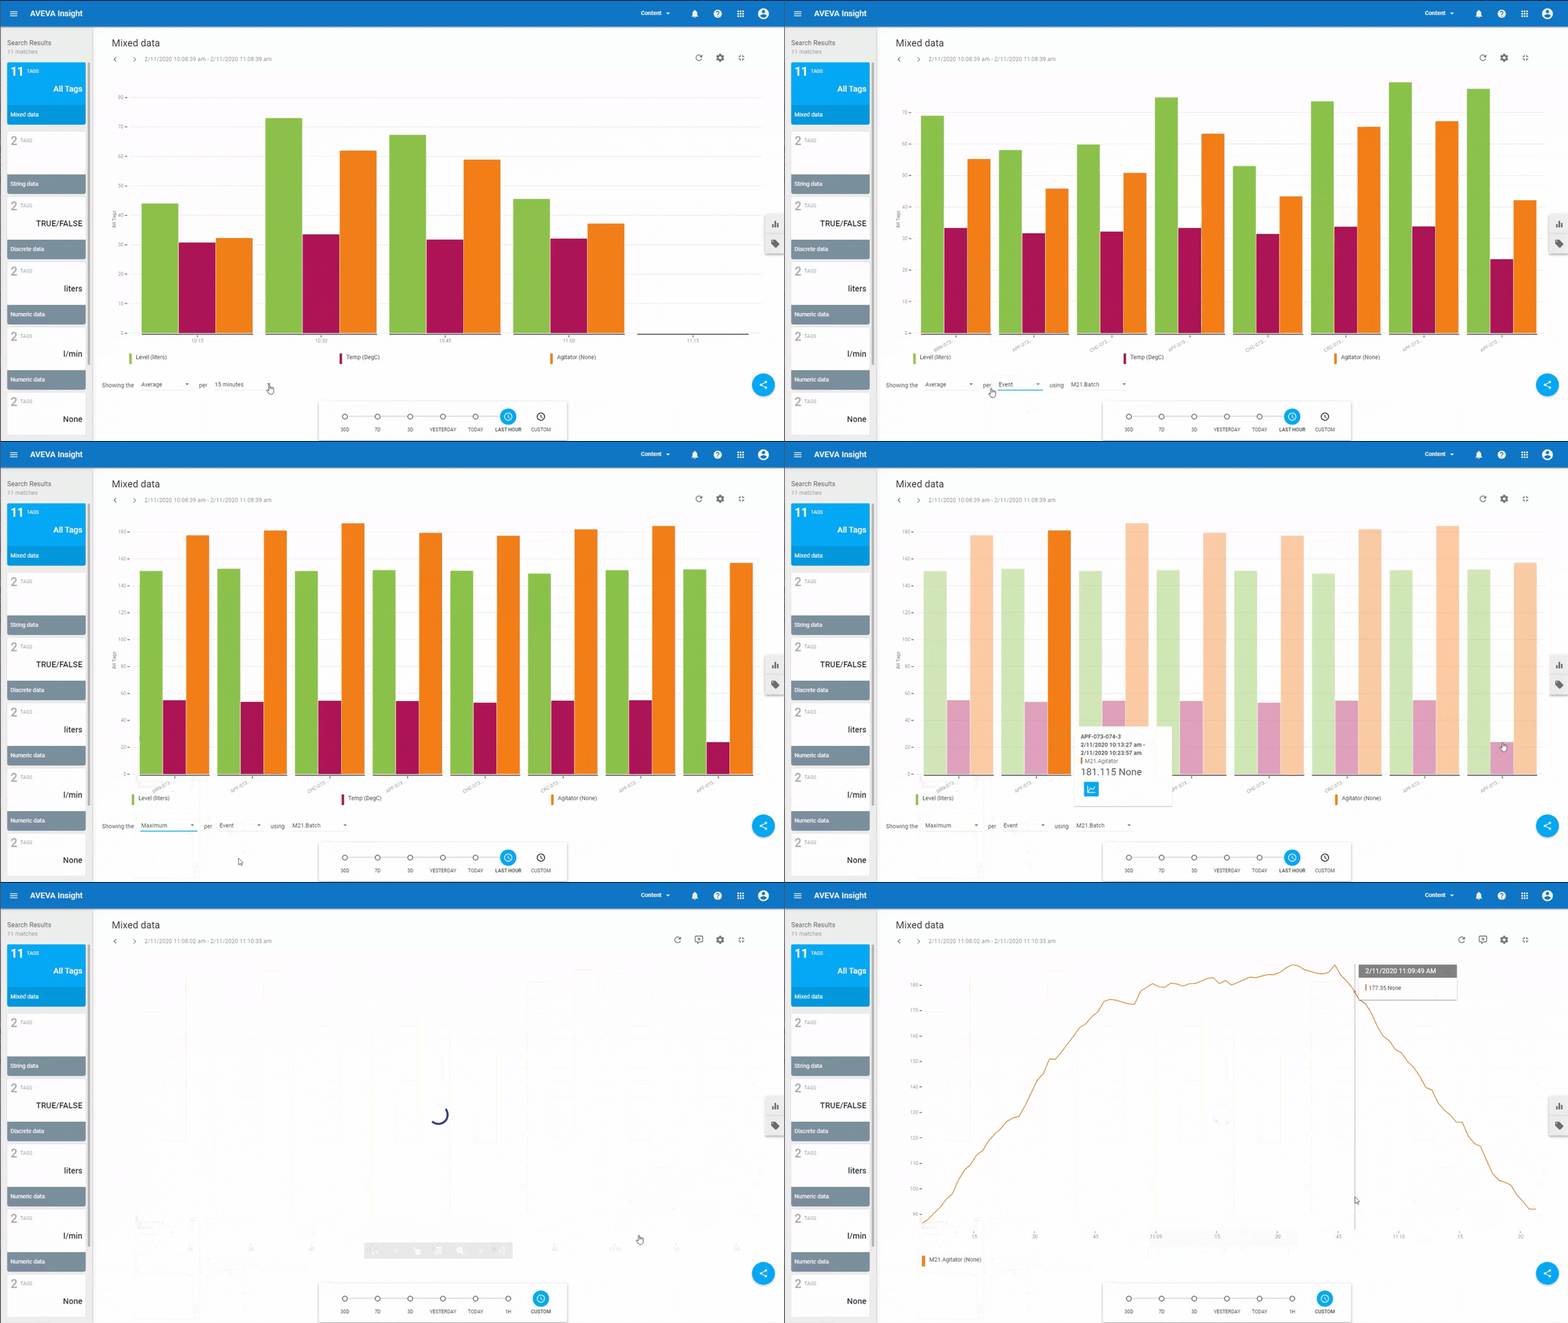
Since the beginning, AVEVA Insight could show summary statistics for common intervals e.g. an hour. Now, we’ve added option to have the same statistics calculated based on an event, such as a batch ID, product code, or digital value. Here, each group of columns represents a batch. Click on a column to get the exact period with the option to drill through to a Line Chart just for that batch.
This makes it much easier to analyze the data relevant to you, and make better, faster decisions.
Clutter-free search
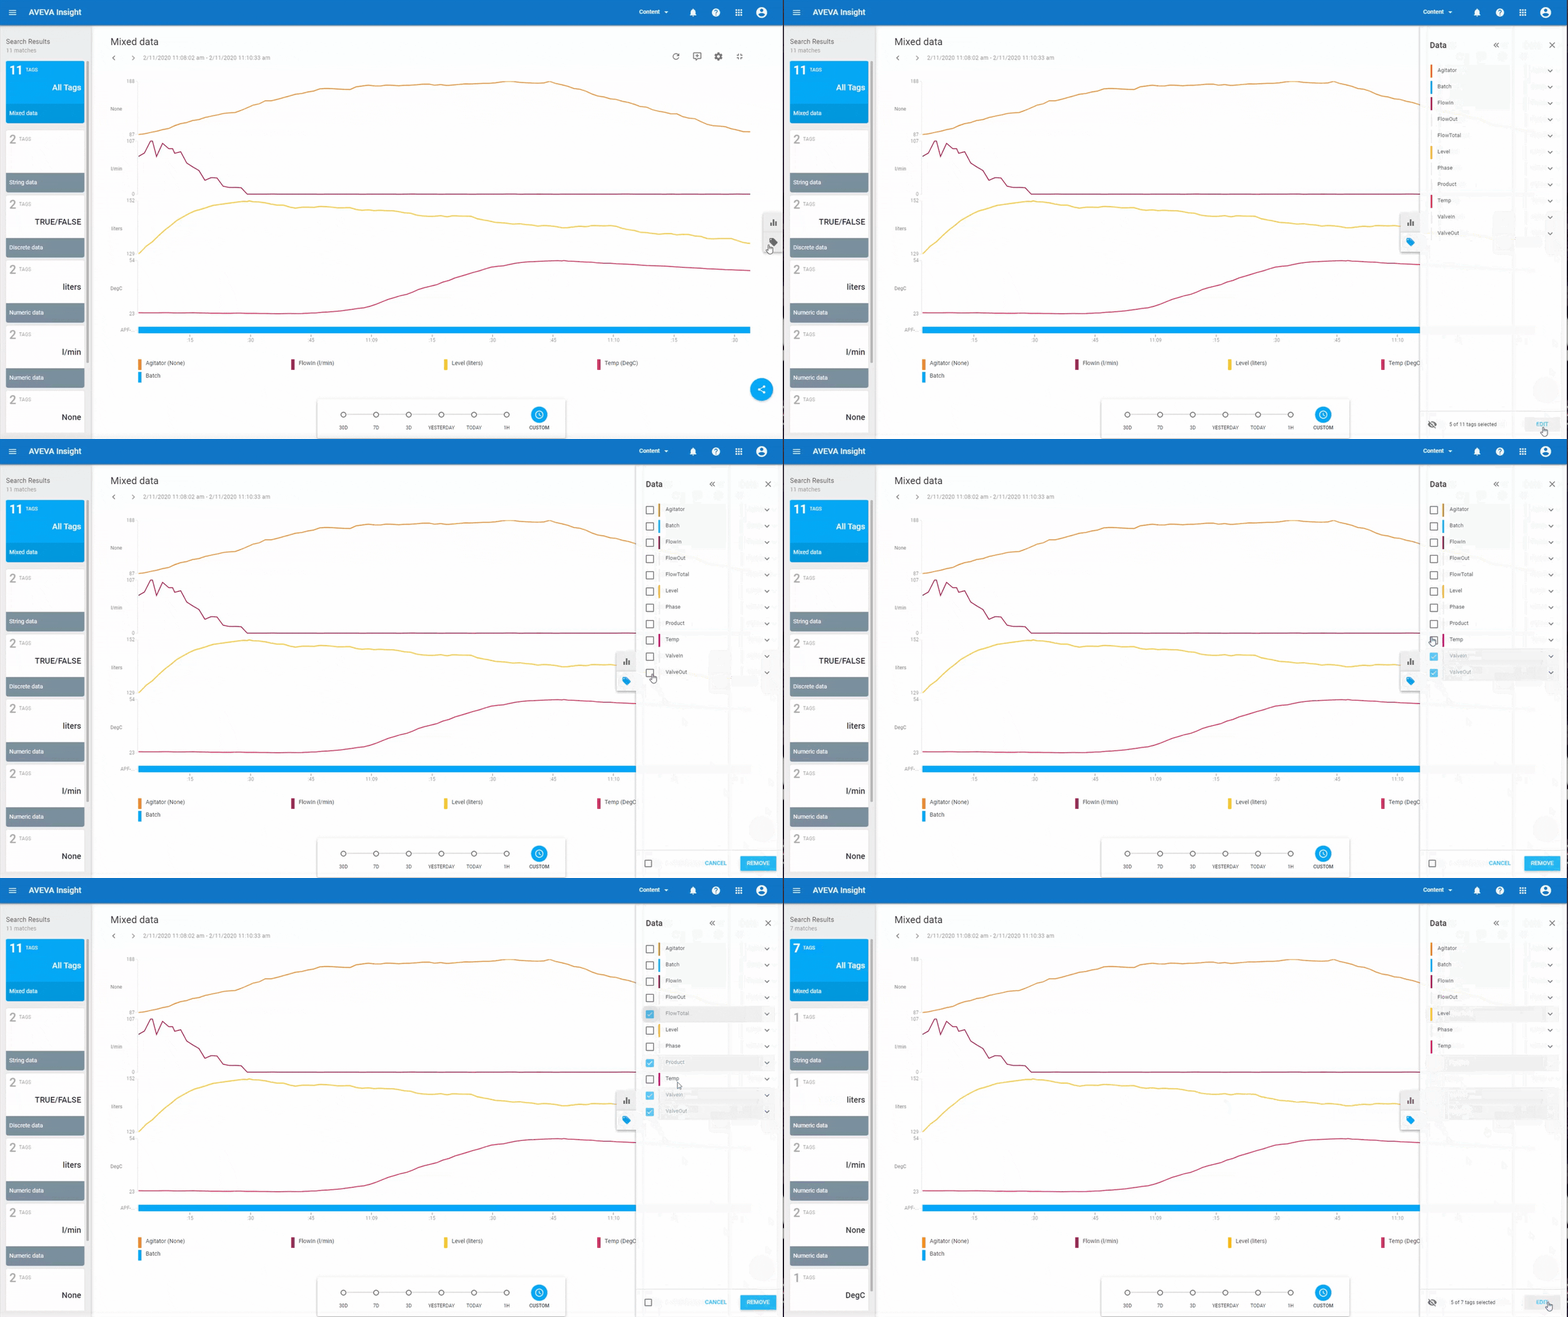
Search is a super-simple way to find data of interest, but sometimes you end up with extra results that can clutter your content. You told us that you’d like a way to remove those extra tags from your result set so now, you can remove tags just as easily as you can add them. Simply open the tag dictionary and select the tags you want removed, and hit remove. That’s it, clutter-free content is all yours.
Managing production shift
To make it even easier to manage your production shifts we have introduced new capabilities around asset time zones, and shift patterns.
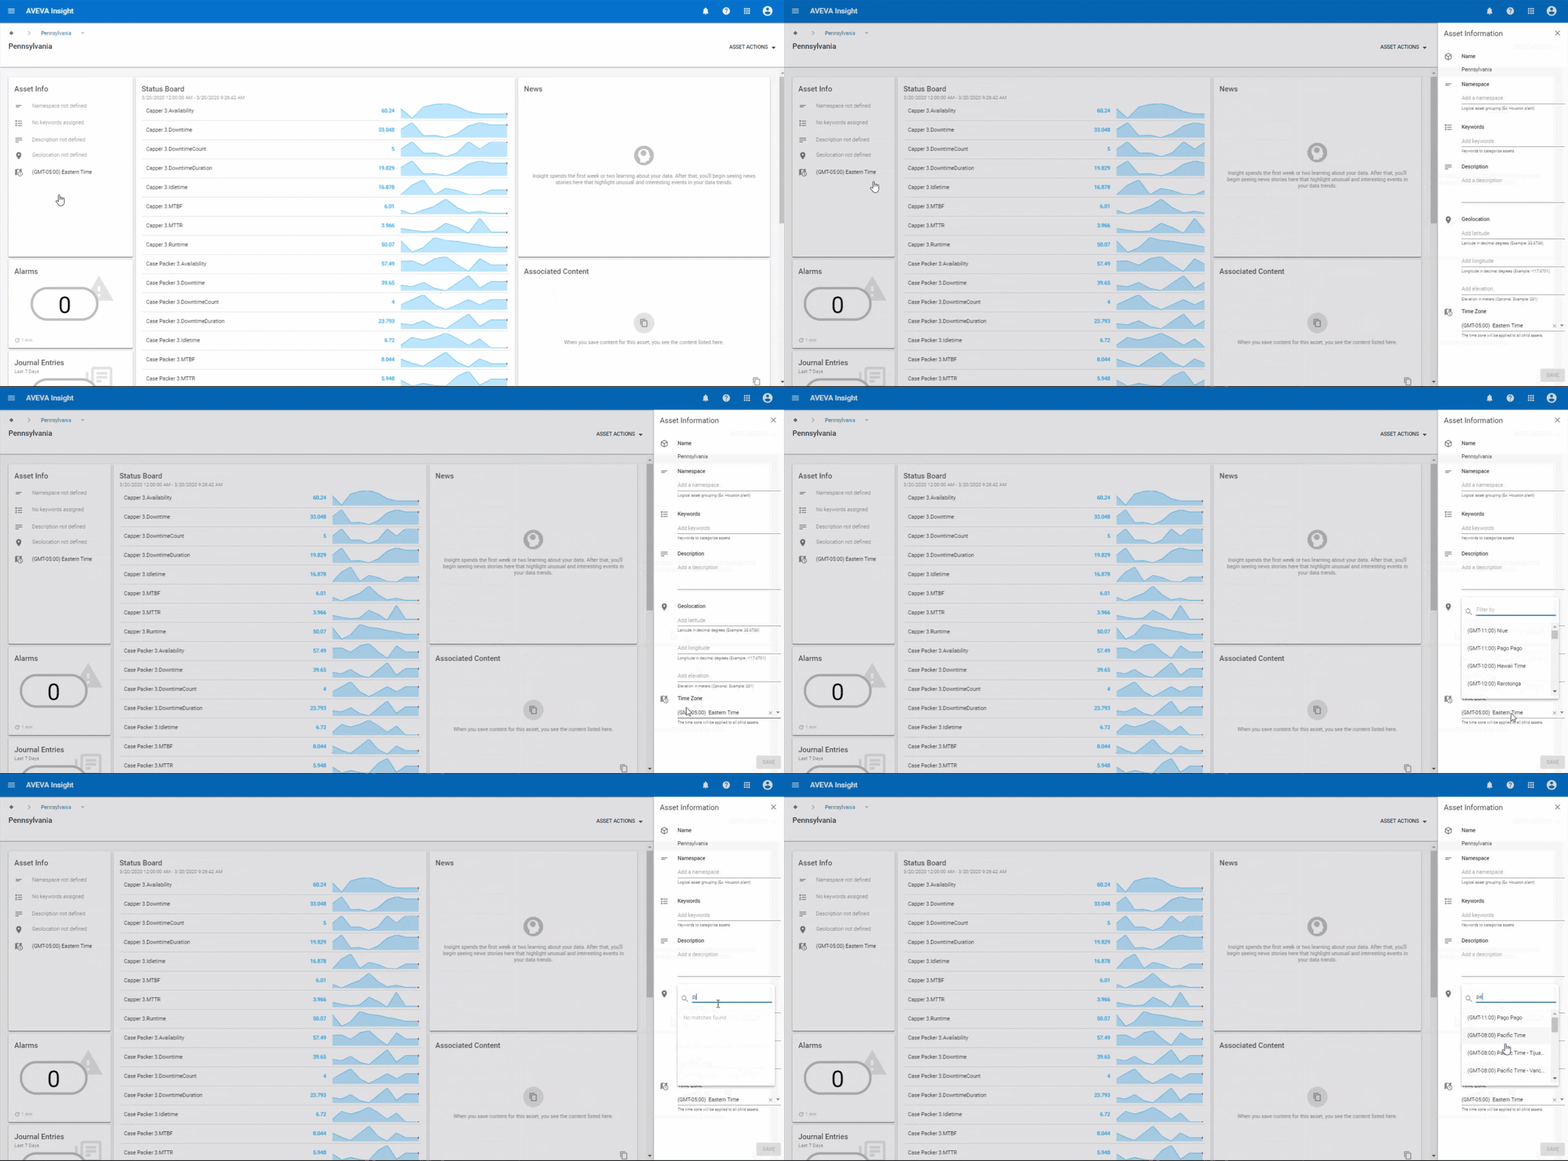
Each asset now has an associated time zone. Like other metadata on the Asset Page, the time zone can be configured by clicking on the Asset Info card and selecting the time zone from list of options available in the sidesheet. This can be configured by any user with Admin privileges.
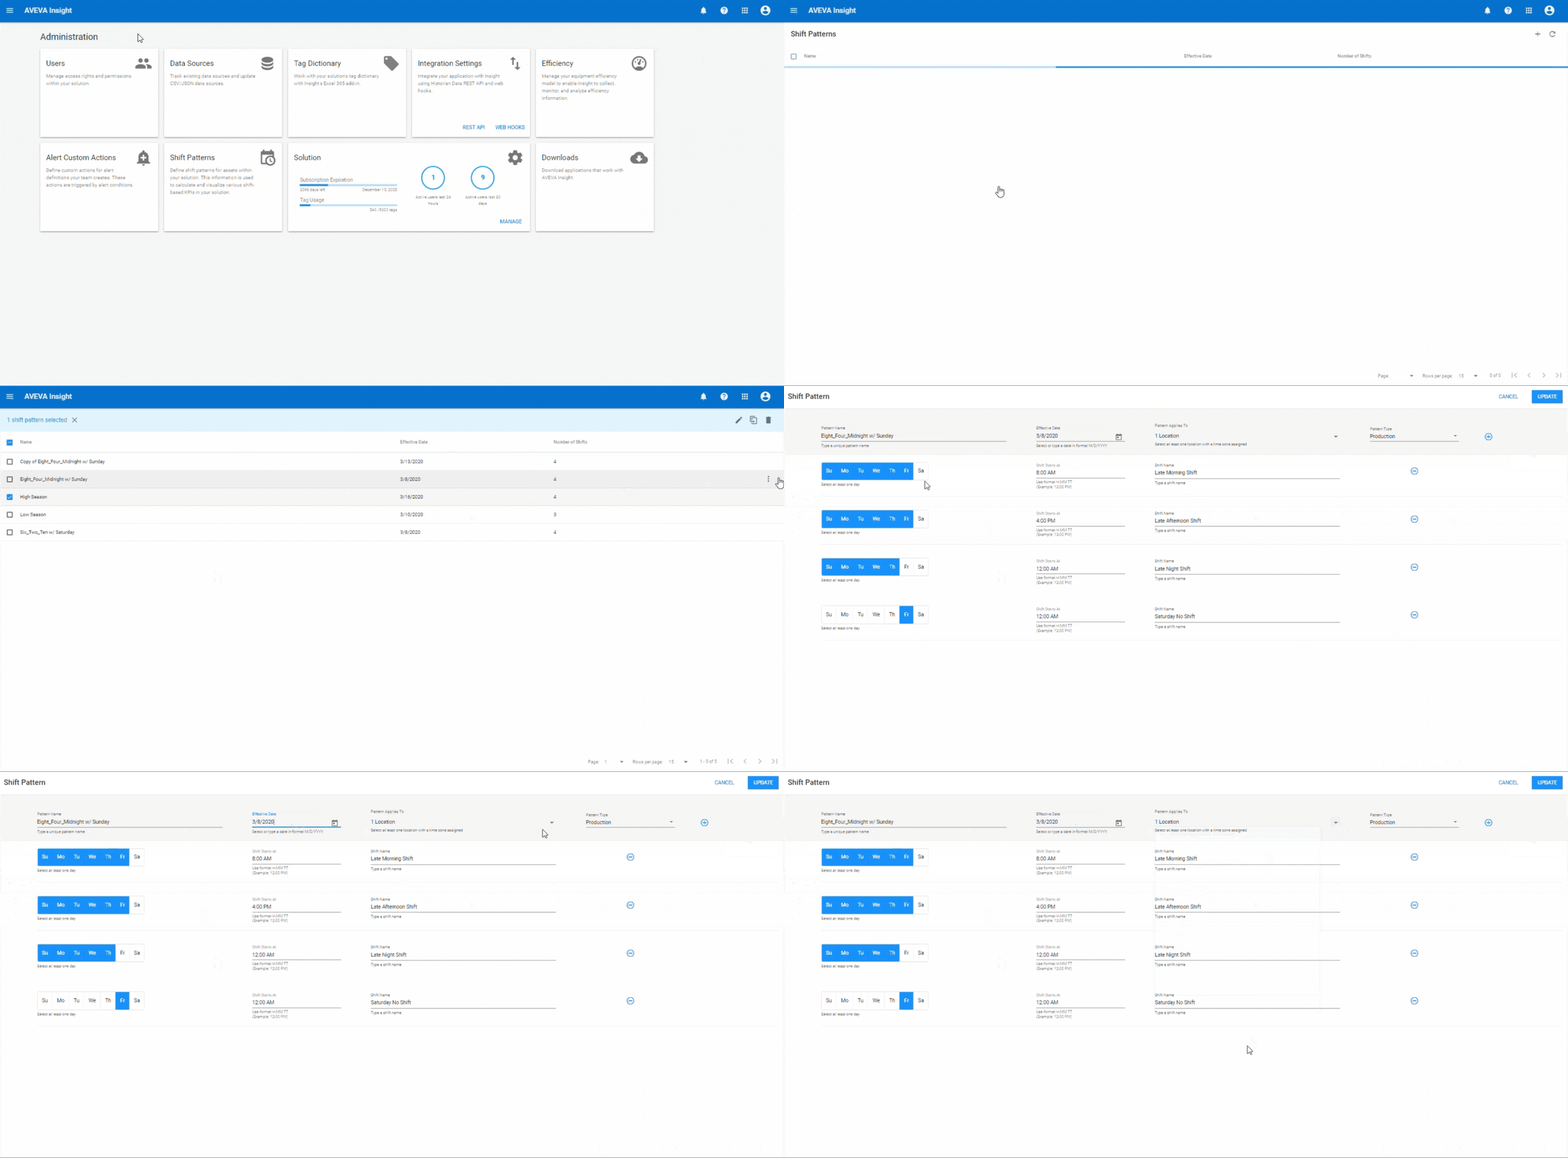
The time zone supports the ability to define shift patterns for production. A shift pattern is simply a collection of shifts, and you can create multiple shift patterns to suit your organization’s needs. For example you might have a different shift pattern for different times of the year, or days of the week.
Each shift pattern has a name, an effective date for when it becomes active in the system, and a list of locations to which it will apply. This means that different locations may be setup with different shift patterns to match local operating procedures. Within the shift pattern, you can define multiple shifts. Each shift has a start time (which is based on the local time of the asset) and a day of the week to which it applies. Each shift continues until it is replaced by the next defined shift, so if you have periods where this is no shift, then you would define those time periods as well. Here we can see how shift patterns would be configured within the Administration tool.
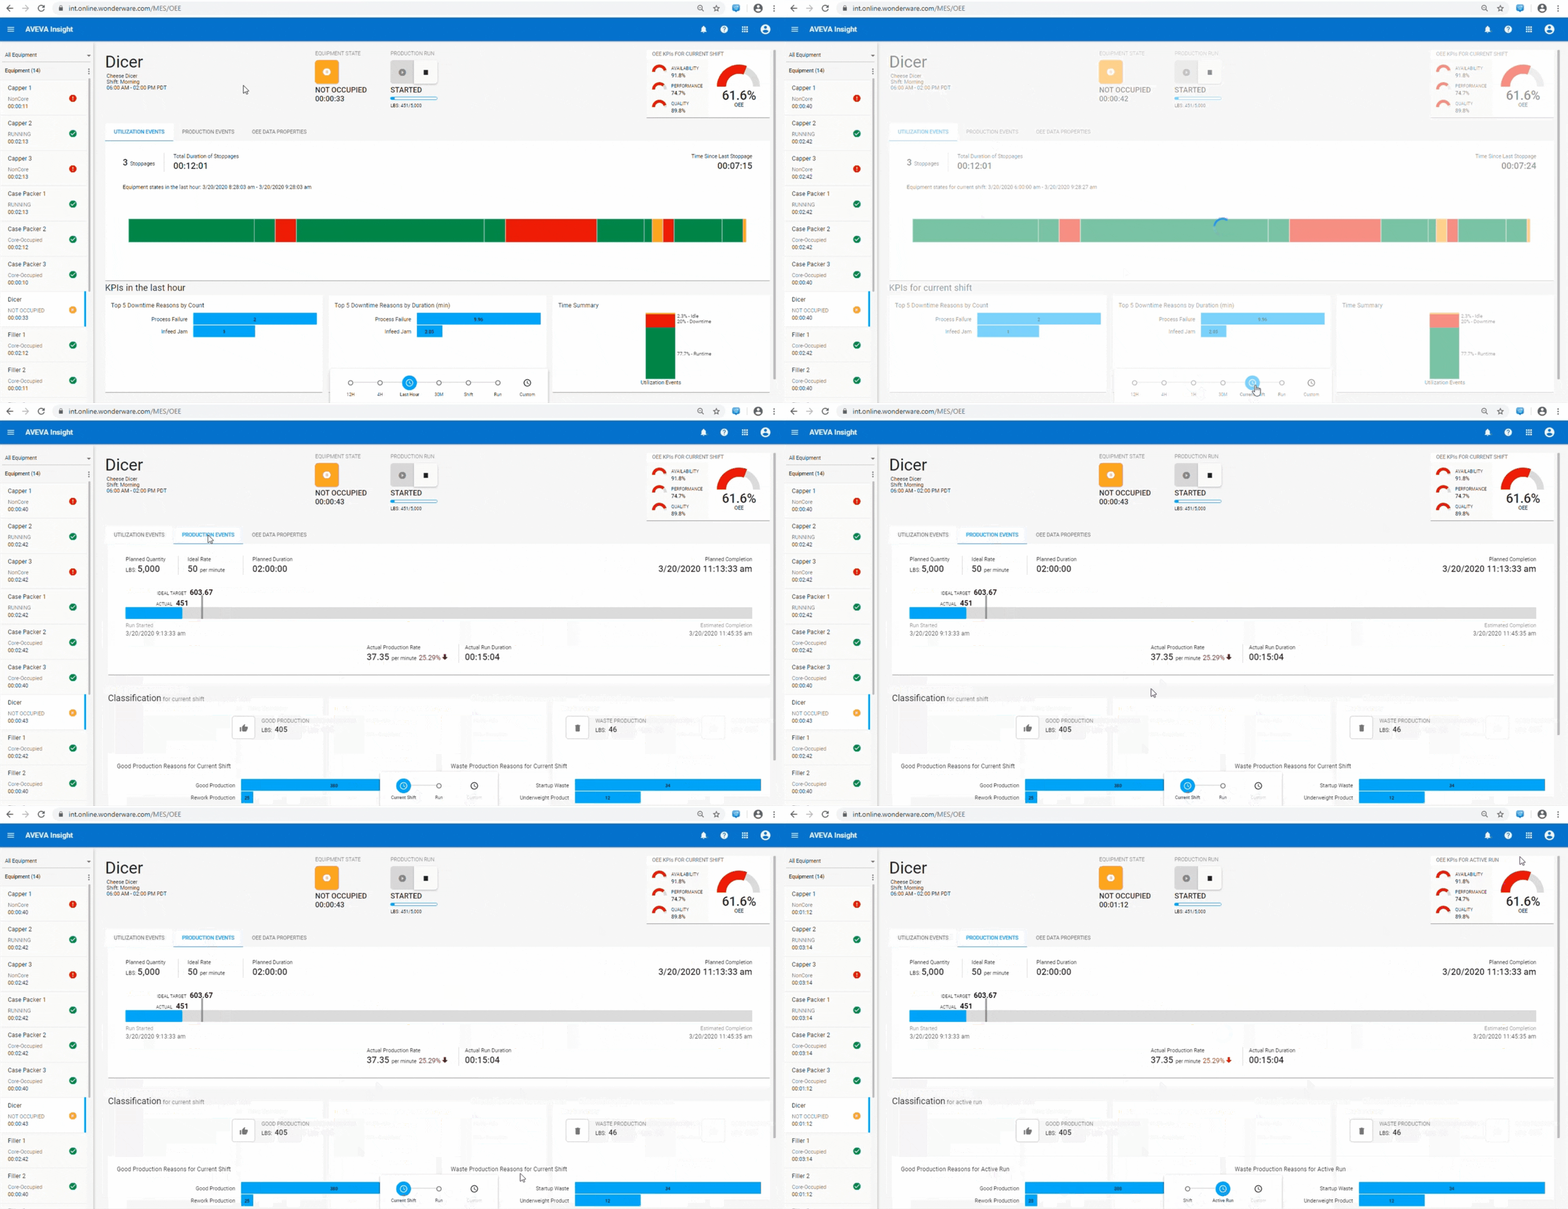
Once you have defined the shift patterns and applied them to the right assets, you can then access this information in various places throughout Insight. On the Utilization and production events tabs for an asset, you can now filter the visible information by Current Shift (in addition to the time or production run options previously available). KPIs and asset information will now refer to the current shift. On the production events tab, some information still relates to the active run, such as total quantities produced and target values, as this is the most important information in that view.
The OEE analysis view also now supports grouping events by shift, providing summary data such as average availability, OEE, performance and quality by shift.
Enhancements to OEE and production capabilities
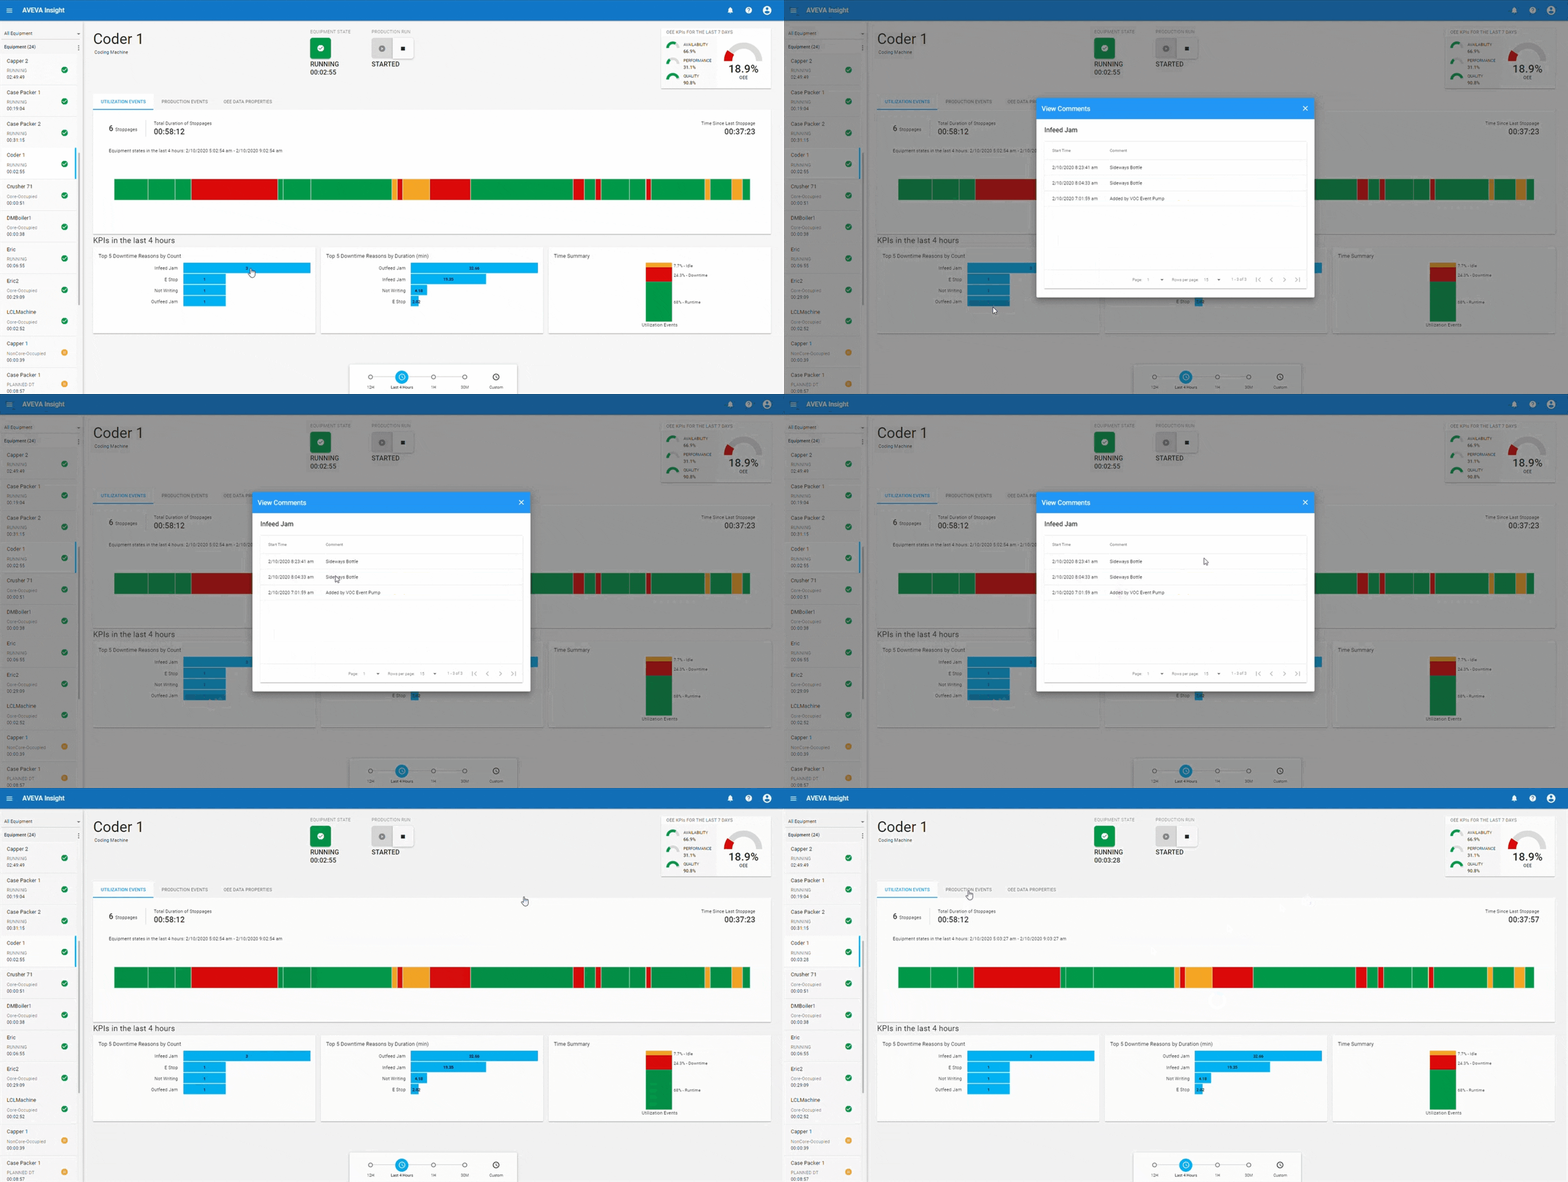
On the OEE pages, you can now easily see which utilization events have had comments added to them, making it easier to capture information at a glance. You can also retrieve those comments directly from the Pareto charts. In this example, you can see that the top downtime reason is an infeed jam, and users have added 3 comments to help the user understand what has happened during these events. Understanding this information helps users better understand issues and collaborate to improve performance of the system overall.
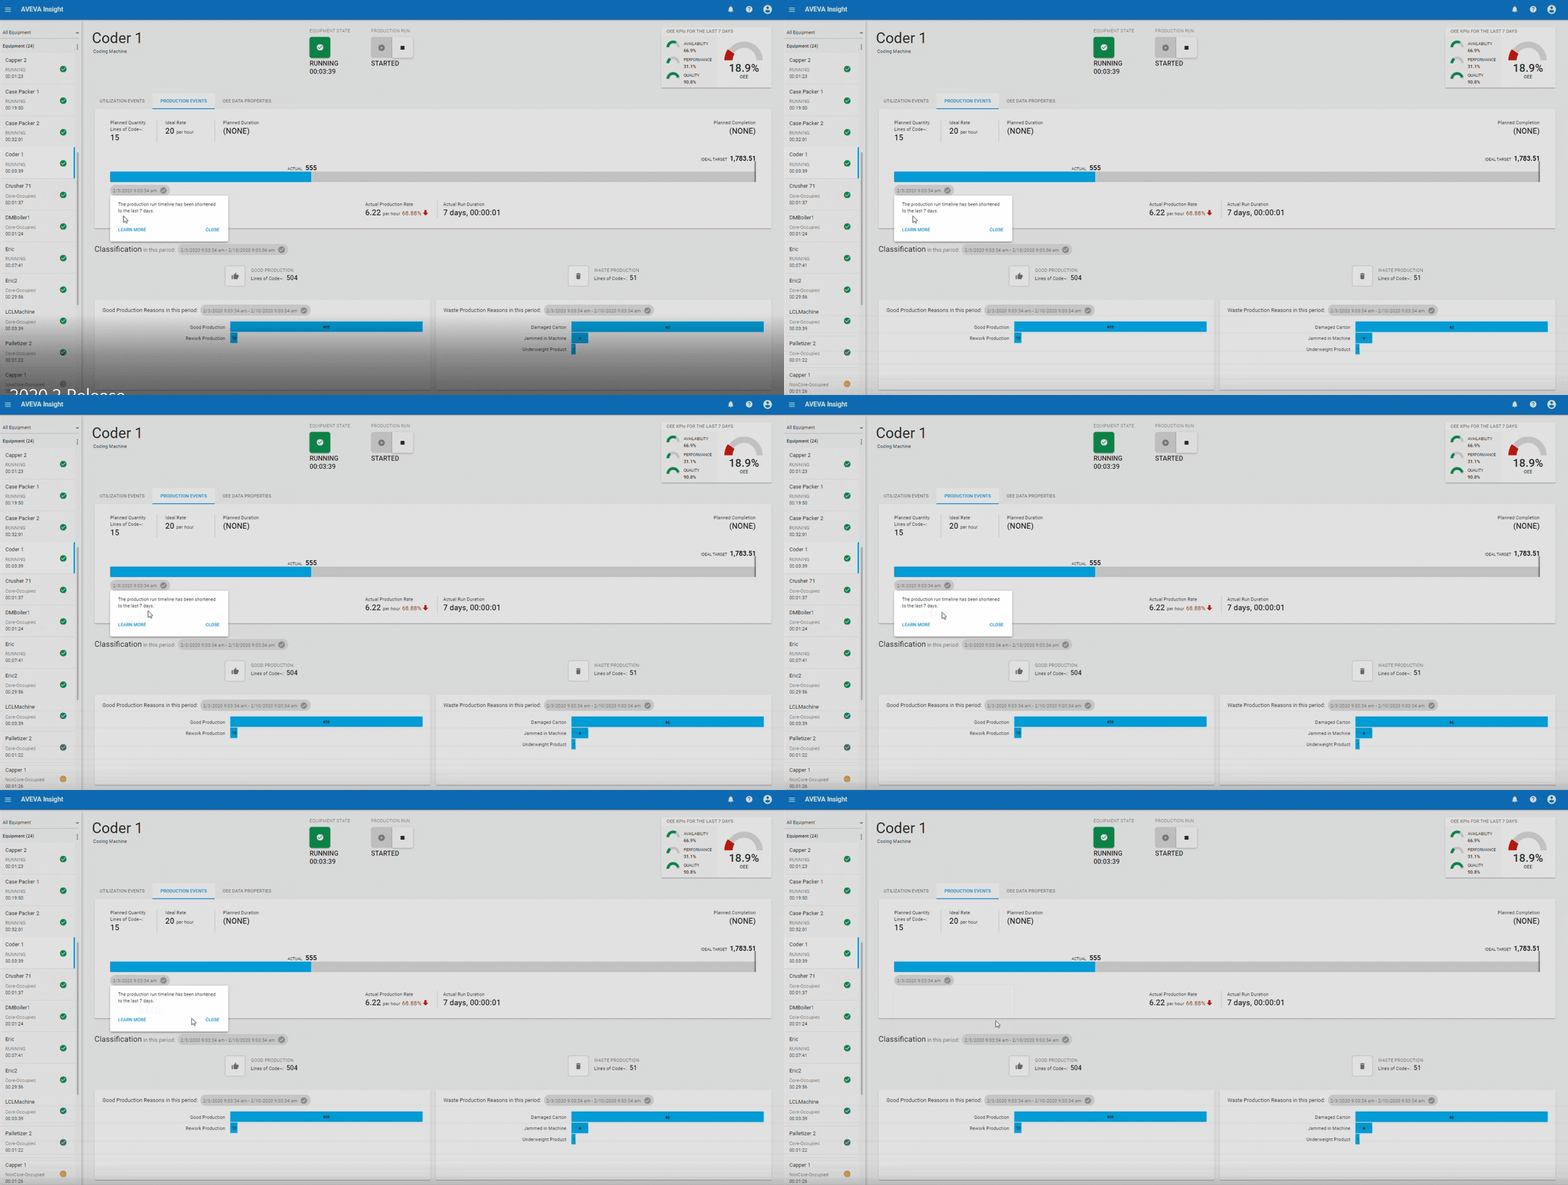
When we switch to the production events tab, you can see that for a very long production run, the production window now displays for the last 7 days. This ensures that you continue to get a quick response time on the production events tab, even when there is a lot of data to process. The grey highlighted text shows the production window represented on the page.
The Estimated Completion Date and Production Progress information is not available since production counts before the start of the window 7 days ago are not known and the Actual Production Rate, Pareto Bar charts, and OEE KPIs are all calculated for the 7 days shown on the page. If you do want to see older data associated with this production run, you can still go and see this through the OEE analysis pages.
Custom actions for alerts
As part of our ongoing investment in condition management, we’ve continued to improve the alerts capabilities in Insight. Now we are simplifying and extending custom actions and adding support for consequence of failure configuration as part of the alert definition.
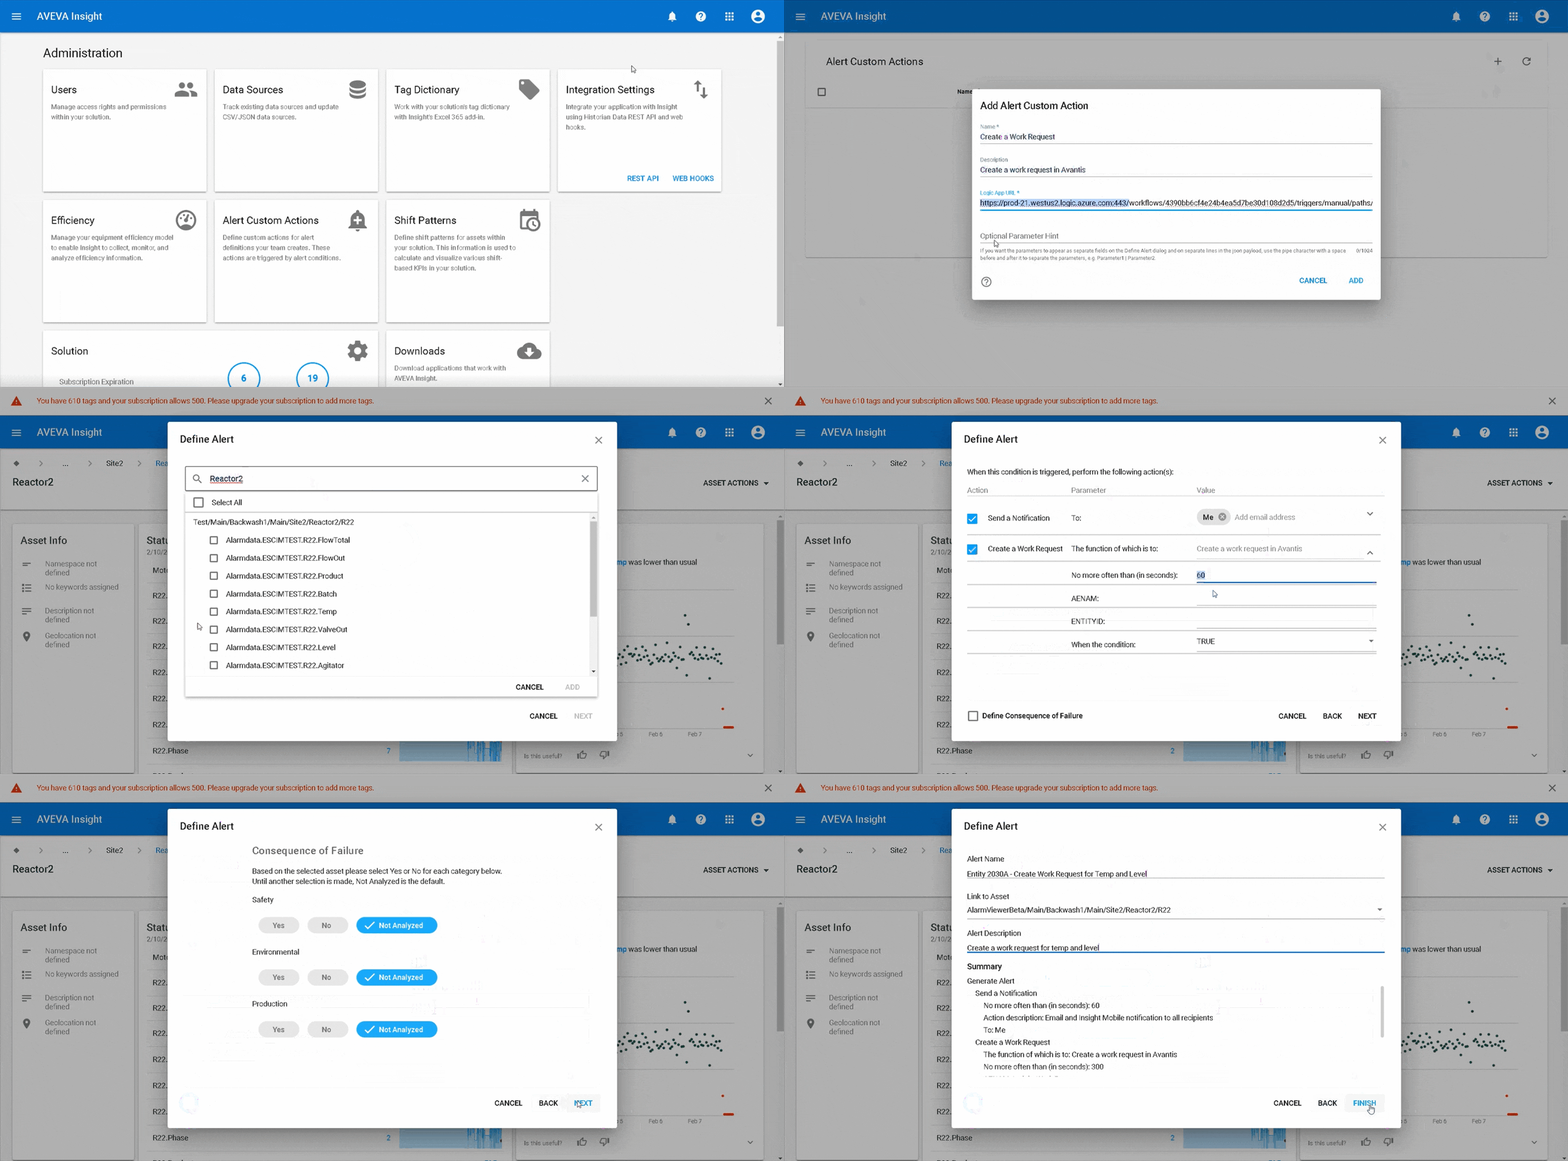
Custom actions allow you to setup Azure logic apps to trigger based on an alert condition being met. A common use case might allow alerts to trigger a work order in an external asset management solution such as AVEVA Enterprise Asset Management or SAP.
Define the custom action by providing the name, description, Logic App URL and any optional parameters to be passed to the logic app when the alert is triggered. You’ll notice that the parameters in this example have been separated using the pipe symbol. This tells Insight to show them as separate configuration fields in the alert definition, making it simpler for users to understand and configure the action in their alerts. Once you get to the actions page of the alert, select the custom action, update the information and fill in the appropriate parameters needed for the alert to be sent. Now AVEVA Insight will trigger the necessary action whenever the alert parameters are met, and you will be kept up-to-date with system behavior.
We’ve also added consequence of failure information that can be configured for an alert. Simply enable this in the wizard and configure the notifications that you want to send to the user – if this alert has implications related to safety, environmental impacts or production performance. The user will then be notified of this when they receive the alert, giving them additional context with which to respond to the alert that they receive.
Subscription banners
Finally, we heard your feedback for more information to remind you when your subscription was expiring, so we’ve added banners to remind you when your renewal date is close. Within 30 days of expiration, solution administrators will be notified of the number of remaining days so they can action the renewal. If the solution then expires, all users will be notified through the banner that the solution is overdue for renewal.
Try Insight for yourself – see how it works, looks and how it could benefit your organization today. No server infrastructure required.